The Data on CA Institutional Landlords

By Devin Lavelle & Tamoor Ali
Large institutional landlords are expected to own apartment complexes, given the capital involved. By contrast, smaller investments such as a house, duplex, or condo are much more accessible to smaller owners, who have more commonly acted as landlords for these types of housing. Additionally, large investments in these spaces may compete with Californians seeking the American Dream of homeownership. These factors may underlie concern expressed about the role large landlords play in the single-family rental market, which have resulted in frequent requests from California policymakers for information on the topic.
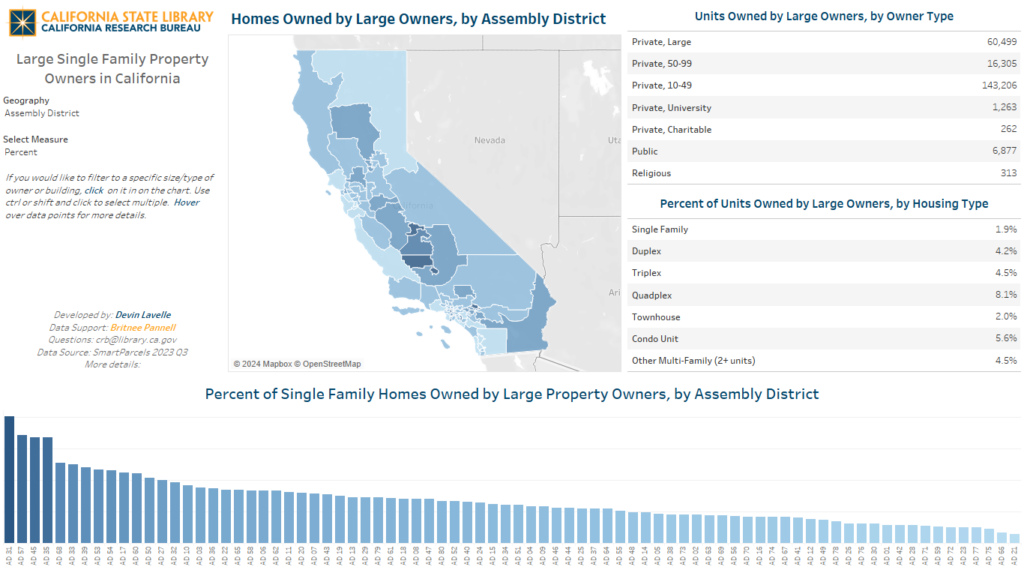
The California Research Bureau has repeatedly been asked about the prevalence of real estate purchases by large institutional investors. Research on the topic is limited and data on housing rentals is broadly inadequate and even more challenging in this space, but with the acquisition of a statewide parcel dataset, we are now able to provide rich insight into the prevalence and locations of these rental homes, through a new tool, Large Single Family Property Owners in California.

We have included several observations made while using this tool and invite California policymakers and their staff to seek more in-depth answers on the questions raised, or to find inspiration for new applications for these tools that will support the Governor and the Legislature in developing better public policy for the people of California.
Summary Findings
Through this analysis, we were able to identify 60,500 homes that are owned by owners with over 100 parcels. An additional 16,300 are owned by owners with 50-99 parcels. The largest share are owned by owners with 10-49 parcels, totaling 143,200 parcels. This breaks down as follows, among various types of housing:
- Single-family: 141,600 parcels (1.9% of all parcels of this type are owned by owners of at least 10 properties)
- Duplex: 10,800 parcels (4.2%)
- Triplex: 3,000 parcels (4.5%)
- Quadplex: 5,300 parcels (8.1%)
- Townhouse: 900 parcels (2.0%)
- Condos: 67,700 parcels (5.6%)
- Other, 2+ units: 2,400 parcels (4.5%)
Among the owners with at least 100 parcels, the largest include:
- Invitation Homes (11,800 parcels)
- COBRA 28, LP (3,100 parcels)
- JD Home Rentals (2,600 parcels)
- Ardenbrook (1,300 parcels)
- Tricon American Homes (1,100 parcels)
Ardenbrook’s properties entirely consist of condos. The other largest owners have a mix of types, but primarily consist of single-family homes.
The tool can filter to certain property types for users who would prefer to analyze the data, perhaps to focus more on the single-family lifestyle, instead of more broadly considering properties that could be owner-occupied under current configurations (for example, the difference between an apartment and a condo).
Across the State
Properties in the tool are distributed widely across the state. The largest number are found in the largest southern California counties, Los Angeles (48,100), San Bernardino (19,400), and Riverside (18,000), followed by Sacramento (13,600), San Diego (13,200), and Fresno (13,200).
As a percent of total housing of these types, counties in the southern central valley lead the way. Fresno has the largest share (5.9%), followed by Tulare (5.6%), and Kern (5.0%).
By District
The median Assembly district has 2.4% of its residential parcels in these categories owned by owners with at least ten parcels. Four districts, in particular, stand out:
- AD 31: 8.0% (7,700 parcels)
- AD 57: 6.8% (3,900 parcels)
- AD 45: 6.7% (6,600 parcels)
- AD 35: 6.7% (6,600 parcels)
The larger Senate districts predictably show less variation. Three stand out:
- SD 16: 6.0% (11,500 parcels)
- SD 14: 5.8% (11,700 parcels)
- SD 29: 5.4% (10,300 parcels)
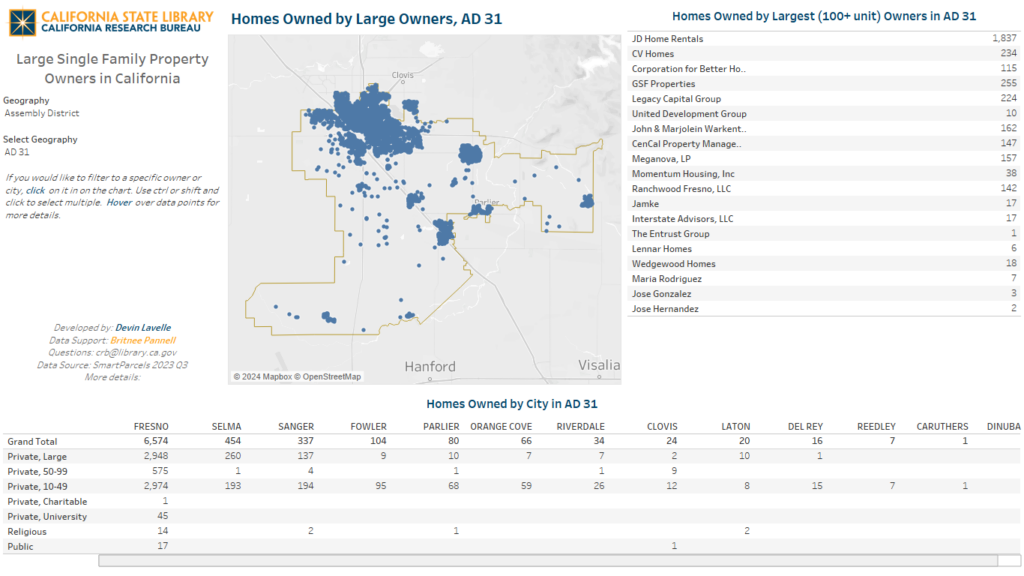
The tool allows users to dig into individual districts. For example, it shows AD 31’s identified properties are primarily in the northern portion of the district, especially Fresno’s Roosevelt and Edison neighborhoods and includes most of JD Home Rentals’ properties.

By Company
Invitation Homes properties are primarily dispersed across Los Angeles (3,200), Riverside (2,400), Sacramento (1,900), San Bernardino (1,300), Solano (1,100), and Contra Costa (600) counties.
Cobra 28, LP properties are concentrated in San Bernardino (1,300), Riverside (1,000), Los Angeles (400) and Kern (400) counties.
JD Home Rentals properties are primarily in Fresno (1,900), as well as neighboring counties (totaling about 600).
Ardenbrook properties are in Alameda (900) and Contra Costa (400) counties.
Tricon American Homes are primarily in Solano and Contra Costa counties.
The next 10 largest owners, with between 500 and 800 total parcels, are primarily in Alameda (2,100), Los Angeles (1,800), San Diego (1,000), San Francisco (700), and Riverside (400) counties.
Over Time
One question that has been raised repeatedly is how these numbers have changed over time. The database provides limited insight into the question because it represents a quarterly snapshot in time, and we only have data beginning in 2023. That said, we can provide some insight based on the most recent purchase date for these properties. Among the challenges with this approach are that it does not account for the status prior to this sale, whether it was built to rent, bought from a different landlord or transferred on paper from a related corporation or whether it was previously owned by its occupant. The approach also omits prior sales of properties that have been transferred more recently, meaning it will understate the number of purchases in a give year more and more over time. Because of these limitations, we did not build this analysis into the tool, but can provide the following insight.

Looking at all of the parcels in the dataset, we see a fairly clear trend, with most years totaling 5,000 to 7,000 purchases, but a spike for several years during and in the aftermath of the Great Recession and a decline since the onset of COVID-19.
When we focus on the largest owners, with over 1,000 parcels identified, we see something even more dramatic. Purchasing by this group totaled only a few hundred parcels through the Great Recession. Briefly, in 2012 and 2013, a spike occurs, primarily driven by Invitation Homes, which added nearly 4,400 homes. Tricon American Homes also added nearly half of its homes over these two years. Invitation added a additional 2,000 homes over the next four years, but has slowed considerably since, adding about 300 properties over the last five years. JD Home Rentals and Ardenbrook largely acquired their properties in earlier years. Cobra 28, LP has purchased its properties more steadily over time.

A Little Context
The next question is how investors in the single-family housing market impact families and communities. While there is a fair amount of research on the topic, the impacts appear mixed. Of particular note, a 2023 Urban Institute study found that none of the top metro areas for institutional investors were in California.
A 2023 Brookings Institute review found mixed impacts from institutional landlords, compared to others. For example, Brookings finds that they do tend to increase prices significantly, but that this appears tied to their investments being concentrated in areas seeing significant economic growth and associated price increases, which drew the investors to the market. Large institutional landlords tend to be more tied to market dynamics, leading to earlier price increases but also earlier leveling when markets cool. Brookings founds that while institutional investors do file more evictions, it was unclear whether the evictions are executed at the higher rate or if this is simply a rent collection tool. The Brookings review found that large investors tend to use more systematic, objective screening standards, and tend to own newer properties and do more up-front repairs to reduce maintenance costs.
Examples of other recent studies include:
- A 2022 study in Social Forces found that large landlords in Boston filed evictions more frequently than small landlords. A 2018 study in Cityscape found similar results in Atlanta.
- A 2023 study in The Review of Financial Studies found that large landlords in the single-family market leverage their market power to increase prices, but significantly improve public safety in these neighborhoods.
- A 2023 study in Real Estate Economics found that real estate investment leads to increased prices, which triggers increased supplies, including multi-family units.
- A 2023 working paper from the Philadelphia Federal Reserve found that institutional investors preserved a portion of falling home values in the Great Recession.
- A 2023 study in the Journal of Planning Education and Research found that institutional investors impact home ownership rates in Atlanta, especially among Blacks.
- A 2023 working paper from NYU Stern found that institutional investor purchases increased home prices, but decreased rents and increased neighborhood access to financially constrained individuals.
How We Got There
Identifying large owners can be a challenging process. There is not a clear field that identifies the parcels as being owned by a large property holder or a code to identify common owners. Some owners, such as Ardenbrook, are straightforward. All of their properties are listed as being owned by “Ardenbrook, LP” with the same mailing address. Others, such as Invitation Homes, are much less straightforward, using names like “2018 1 IH BORROWER LP,” “CSHP ONE LP.” and “IH6 PROPERTY WEST LP.” with at least 50 different mailing addresses.
The data come from LightBox’s SmartParcels dataset, which was acquired through an agreement with the California Department of Technology. The dataset includes parcels from across the state, including ownership information. Data come from the 2023 Q3 release and are generally current through late 2022, though variations exist across counties.
To develop our estimate, we filtered the data to include the following residential housing types: Single Family Residential (1001), Townhouse (1002), Condominium (1004), Duplex (1101), Triplex (1102), Quadruplex (1103), Multi-Family Dwellings – Generic, any combination 2+ (1110), and Single Family Residential – Income (1999). These property types were selected to take a broad view of homes that could reasonably be owner occupied and the tool allows users to filter to more narrow definitions, if desired.
Next, we filtered to parcels with physical addresses that do not match the mailing address and filtered out homes built since 2021 with a blank buyer name field, assuming these are likely still owned by the homebuilder.
Finally, we aggregate by owner to identify entities that own 10 or more homes and filter to this group for further analysis. Note that this approach may miss some individual properties that are part of a larger group because the specific name was sufficiently unique and may miss some smaller owners in the 10-50 group altogether. As such, these estimates likely understate the real totals, but likely only by a small amount. The data processing work was completed by Britnee Pannell, senior GIS specialist at the California Research Bureau.
From there, we manually attempted to identify common owners, identified in common English, for property holders with 100 or more parcels, using records on the internet. This is an extremely time consuming and sometimes imprecise process. Some properties may have been missed from larger owners and others may have been misidentified, if the internet sources were incorrect or out of date or if properties have similar mailing addresses, perhaps if different owners use the same accountant, or other similar arrangements. While these challenges should only have modest impacts on the data, it is important to understand these estimates should not be considered perfectly precise.
